
Inventory Carrying Cost Calculator
Inventory Carrying Cost Calculator
Enter your average inventory value and the four cost components. Returns total carrying cost, the carrying rate as a percentage, and cost per unit.
Cost breakdown
| Component | Rate | Annual cost | Share |
|---|
Inventory efficiency
If you reduce inventory
| Reduction | New inventory value | Annual saving |
|---|
Inventory carrying cost is the total annual cost of holding stock, expressed as a percentage of average inventory value. It combines four components: cost of capital, storage, service and risk. The inventory carrying cost calculator above returns the total, the carrying rate, the cost per unit and what a reduction in stock would release.
Most organisations land between 18 and 30 percent. A company holding 500,000 in average inventory at a 24 percent rate is spending 120,000 a year simply to have it sitting there, which is usually more than anyone in the business has quantified.
Calculating inventory carrying costs
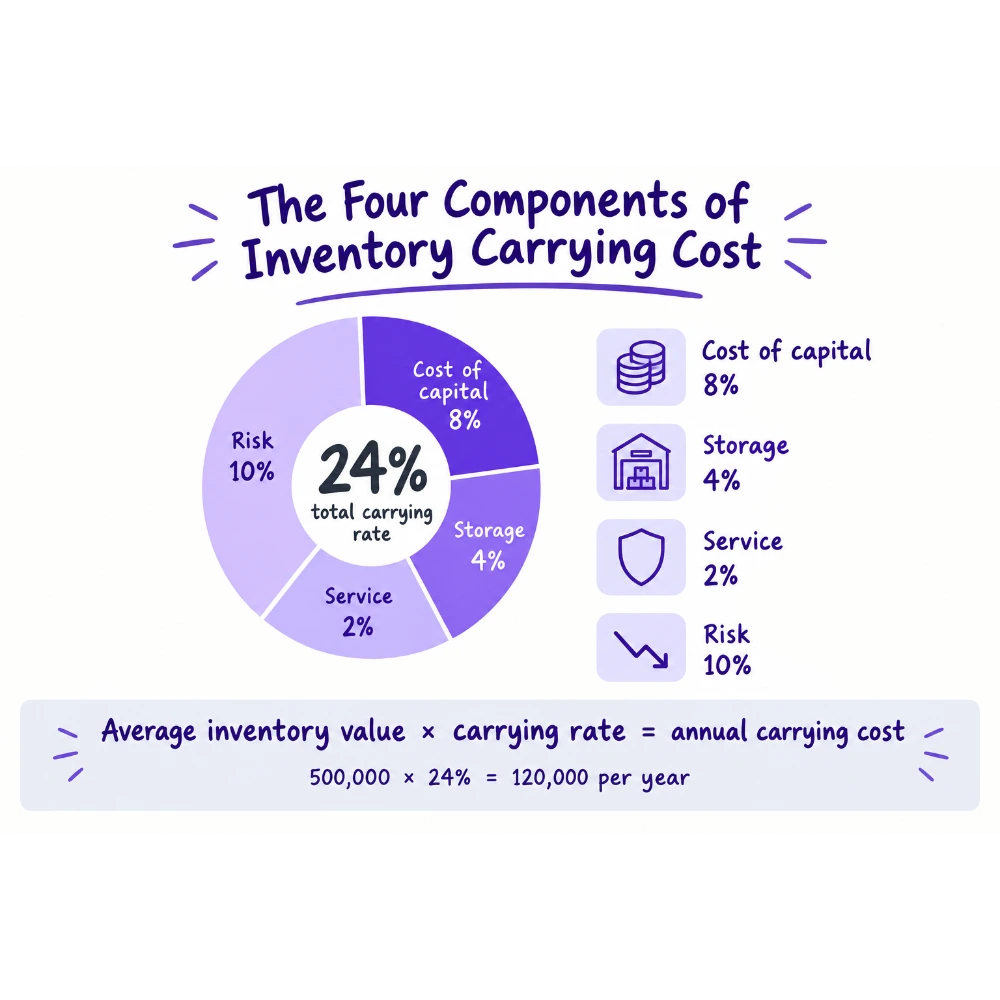
The inventory carrying cost calculation is straightforward once the four component rates are known. Add them together to produce a total carrying rate, then multiply that rate by average inventory value.
| Component | Typical range | What it covers |
|---|---|---|
| Cost of capital | 6 to 12% | Opportunity cost of money tied up in stock |
| Storage | 2 to 8% | Warehouse rent, utilities, equipment, handling labour |
| Service | 1 to 4% | Insurance, property taxes, cycle counting, administration |
| Risk | 3 to 12% | Obsolescence, shrinkage, damage, spoilage, write-downs |
| Total carrying rate | 18 to 30% |
To calculate inventory carrying cost in practice, start from your own figures rather than industry defaults. Storage is available from the facility budget. Service costs sit in insurance and finance records. Risk is the component requiring judgement, and it is what separates a 19 percent rate from a 30 percent one.
Why cost of capital is usually understated
This is the component most frequently set wrong, and the error runs in one direction.
Organisations commonly use a bank deposit rate or a base interest rate, reasoning that the money would otherwise sit in an account. That is not the relevant comparison.
The correct figure is the weighted average cost of capital, or the return the money would generate if deployed elsewhere in the business. For most companies that is several percentage points higher than any interest rate, and substituting it materially changes the total.
Understating it makes inventory look cheaper to hold than it is, which biases every downstream decision toward carrying more stock than the business should.
Why risk cost varies so widely
Risk is entirely product-dependent, which is why a single blended rate applied across a mixed portfolio misleads in both directions at once.
Consumer electronics lose value continuously as newer models arrive. Fashion and seasonal goods can become nearly unsaleable within months. Pharmaceuticals and food carry expiry dates that convert stock into write-off on a fixed date.
Industrial fasteners, raw metals and commodity chemicals carry almost none of this. A stainless steel bolt held for three years is still a stainless steel bolt, and its risk component might reasonably be one or two percent rather than twelve.
Segmenting the portfolio and applying a different risk rate to each class produces figures that actually support decisions. An ABC analysis is usually sufficient granularity, and running the inventory carrying cost calculator separately for each class takes minutes.
What the number is actually used for
Three decisions depend on it directly, and all three are made badly without it.
Safety stock sizing. The trade-off between service level and inventory investment cannot be evaluated without knowing what the investment costs. Service level and buffer do not scale linearly, so the last few percentage points of availability consume disproportionate stock.
Order quantity. Economic order quantity balances ordering cost against holding cost. Understate the holding side and the model recommends larger, less frequent orders than it should, quietly building excess across the whole range.
Slow-moving and dead stock. Whether to discount, write off or continue holding an item depends on what continuing to hold it costs. Many organisations carry obsolete stock for years because nobody calculated the annual cost of not dealing with it, and the write-down is deferred indefinitely at a real cost that never surfaces as a decision.
The planning processes these decisions sit inside are examined in our guide to supply chain planning.
Why average inventory is the order quantity divided by two
A question that arises whenever economic order quantity is introduced: why does the holding term use half the order quantity rather than all of it.
The answer is that stock depletes across the cycle. You receive a full order quantity, consume it steadily to zero, then receive another. At the start you hold the full quantity and at the end you hold nothing, so the average across the cycle is half.
Annual holding cost in the model is therefore the order quantity divided by two, multiplied by the holding cost per unit per year. The ordering cost term moves in the opposite direction, since larger orders mean fewer of them, and the optimum sits where the two curves cross.
In practice depletion is rarely perfectly linear and safety stock sits underneath the cycle, so the true average is somewhat higher than half. For most planning purposes the approximation holds well enough to be useful.
The connection to lead time and forecast accuracy
Carrying cost is the multiplier that converts operational improvements into money, which is why it belongs in conversations that look unrelated to inventory.
Safety stock scales with the square root of lead time, so halving lead time removes roughly 29 percent of required buffer. At a 24 percent carrying rate that is a permanent annual saving on every affected item, which is why lead time reduction frequently outperforms unit price negotiation as a cost lever. The mechanics are covered in reducing transportation cost in logistics.
Forecast accuracy works the same way. Buffer exists to absorb error, so reducing the error reduces the buffer requirement at an unchanged service level, and the release converts to money at whatever rate you calculated. The accountability structures behind that improvement are examined in AI forecasting and inventory planning.
How to reduce the number
Three levers move it, in descending order of durability.
Reduce the inventory itself through better forecasting, shorter lead times and a rationalised product range. This is permanent and compounds, because lower stock reduces storage, capital and risk at the same time.
Reduce the risk component by improving stock rotation and dealing with obsolescence promptly rather than deferring it. A write-down is painful once and expensive indefinitely if postponed, since the item keeps consuming space, capital and administration while losing whatever value it retains.
Reduce storage cost through better space utilisation or renegotiated terms. Real, but smaller than the other two and generally a one-off gain rather than a compounding one.
Supply disruption can undo all three within a quarter by forcing emergency buffer across the range, which is why the risk framework in managing supply chain risk sits alongside cost work rather than separately from it.
Putting it into practice
Calculate the rate once, document the assumptions behind each component, and review it annually rather than rebuilding it whenever someone asks.
Then apply it consistently. The value comes from using the same number across order quantity decisions, safety stock reviews and obsolescence assessments, so those decisions become comparable. A rate that changes depending on who is presenting loses its authority quickly.
Knowing how to calculate inventory carrying cost matters less than having an agreed figure that finance and operations both accept. The inventory carrying cost calculator above is designed to make that agreement easy to reach, because every component is visible and adjustable rather than buried inside a single blended percentage. For continuing coverage of inventory, working capital and planning practice, see our ongoing supply chain operations reporting.
Frequently asked questions
How do I calculate inventory carrying costs?
Add the four component rates together to get a total carrying rate, then multiply that rate by your average inventory value. A 24 percent rate applied to 500,000 of average inventory gives 120,000 a year, or 10,000 a month.
What is the formula for calculating inventory cost?
Carrying cost equals average inventory value multiplied by the carrying rate. Total inventory cost goes further and adds purchase cost and ordering cost to that carrying figure, which is what economic order quantity models balance against each other.
Can you give me an example of a carrying cost?
Warehouse rent on the space stock occupies, insurance premiums covering it, and the write-down when an item becomes obsolete are all carrying costs. So is the return the business forgoes by having capital tied up in stock rather than deployed elsewhere.
What are inventory holding costs?
Holding costs and carrying costs are the same thing, covering capital, storage, service and risk. Holding cost is the more common term in academic and economic order quantity contexts, while carrying cost dominates operational reporting.
Why is carrying cost divided by 2?
Because stock depletes over the order cycle. You receive a full order quantity and consume it steadily to zero, so the average held across the cycle is half that quantity. That is why the holding term in economic order quantity uses the order quantity divided by two.
What is the formula for calculating annual inventory carrying cost?
Annual carrying cost equals average inventory value multiplied by the annual carrying rate. Within an economic order quantity model it is expressed as the order quantity divided by two, multiplied by the holding cost per unit per year.