
Days Of Supply Calculator
Days Of Supply Calculator
Enter stock on hand and demand to get days of supply, weeks of cover, inventory turns and a reorder assessment against your lead time.
Reorder assessment
Position against target
Inventory value
Days of supply measures how long current stock will last at the present rate of demand. Divide stock on hand by average daily demand. The days of supply calculator above returns that figure alongside weeks of cover, inventory turns, a projected stockout date and a reorder assessment against your supplier lead time.
It is the most widely used inventory metric in distribution and manufacturing, and among the most frequently misread, because the answer changes completely depending on whether the demand figure looks backwards at history or forwards at the plan.
How to calculate days of supply
The days of supply calculation formula divides the quantity you are holding by the quantity you consume each day.
| Input | Source | Common error |
|---|---|---|
| Stock on hand | ERP or warehouse system on-hand balance | Including stock already allocated to orders |
| Average daily demand | Shipment or consumption history | Trailing average on a trending item |
| Day basis | Calendar or working days | Mixing the two across a portfolio |
| Stock on order | Open purchase orders | Counting inbound that has not shipped |
To calculate days of supply for a single item, take the on-hand balance and divide by daily usage. An item with 4,200 units moving at 140 a day has exactly 30 days of cover. Add open purchase orders only when you want the projected position rather than the current one, and keep the two figures separate on any report, because they answer different questions.
Days of supply, days inventory outstanding and inventory turns
Three related measures get used interchangeably and should not be.
| Measure | Formula | Level | Used for |
|---|---|---|---|
| Days of supply | Stock on hand divided by average daily demand | Item | Replenishment decisions |
| Weeks of cover | Days of supply divided by 7 | Item or category | Retail and consumer goods planning |
| Days inventory outstanding | Average inventory divided by COGS, times 365 | Portfolio | Financial reporting, benchmarking |
| Inventory turnover ratio | Annual COGS divided by average inventory | Portfolio | Comparing efficiency across categories |
The first two are operational and item-specific. The second two are financial and aggregate. Using days inventory outstanding to drive a replenishment decision produces poor results, because it averages away precisely the item-level variation the decision depends on. A business can post a healthy turnover ratio while carrying six months of cover on a third of its stock keeping units.
Calendar days or working days
This choice shifts the answer by roughly a third and is frequently left undocumented.
Calendar days suit continuous operations, e-commerce and retail, where consumption occurs seven days a week. Working days suit business-to-business distribution and manufacturing supply, where nothing ships at weekends and a 250-day operating year is the realistic denominator.
Match the basis to when demand actually occurs, then apply it consistently across the portfolio and over time. Mixing bases makes comparison between items meaningless and makes trend analysis actively misleading, because a change in reporting convention looks identical to a change in performance.
Reading the number against lead time
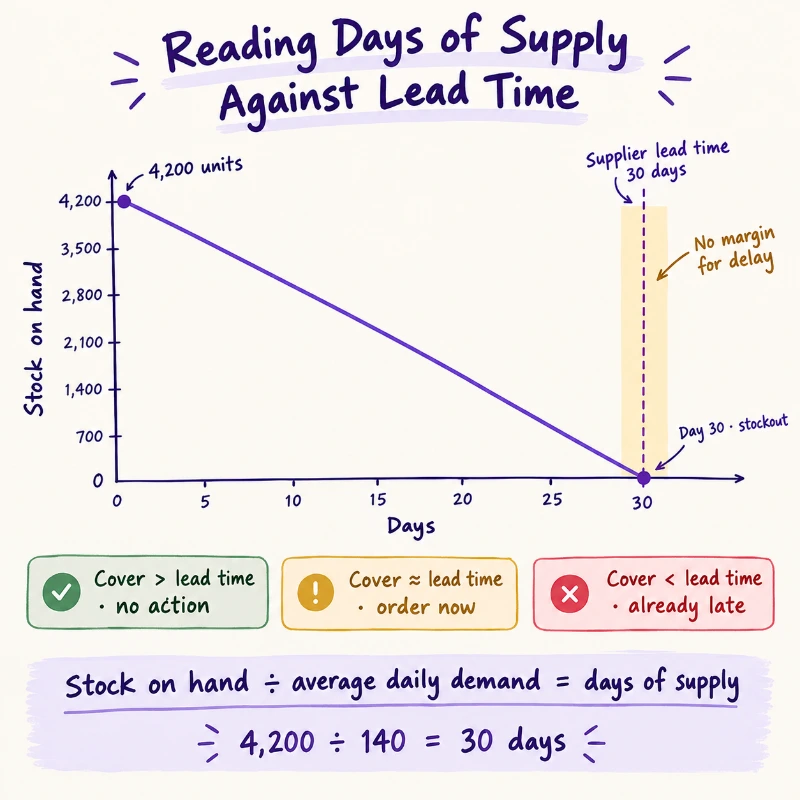
Cover in isolation tells you very little. Thirty days is comfortable against a seven-day replenishment lead time and a developing crisis against a forty-five day one.
The useful figure is cover minus lead time, which is the genuine margin for error. Where that margin is thin, one late shipment becomes a stockout, and no amount of expediting recovers goods that have not left the supplier.
Three positions are worth distinguishing on any exception report. Cover below lead time means ordering today still results in a stockout. Cover between one and one and a third times lead time means there is no tolerance for supplier delay. Cover comfortably above lead time means no action is required this cycle.
The measurement problem underneath is that most organisations compare against the lead time held in master data rather than the figure actually achieved. Those two commonly differ by a third or more, and the gap is examined in our guide to supply chain planning.
Why the demand denominator is usually wrong
Three errors recur, and each produces a comfortable-looking number that misleads in a different direction.
A trailing average applied to a declining item overstates risk, because forward demand is lower than history suggests and the stock will last longer than calculated. That sounds harmless until the item is written off as obsolete.
A trailing average applied to a growing item overstates cover, because demand ahead is higher than the average. This is the version that causes stockouts, and it is most dangerous on newly promoted or newly listed products where growth is steep.
An annual average applied to a seasonal item is wrong in both directions at different points in the year: comfortable through the off-season and dangerous entering peak, which is exactly when the error matters.
For anything with trend or seasonality, the denominator should be forward demand drawn from the consensus plan rather than historical shipments. The accountability structures that make that forecast trustworthy are covered in our reporting on AI forecasting and inventory planning.
Setting a target that can be defended
A target built from components survives scrutiny. A round number chosen because it sounds reasonable does not.
| Component | What it covers |
|---|---|
| Lead time | The minimum cover required to replenish at all |
| Safety stock in days | Demand variability and supplier delivery variability |
| Review period | Time until the next order would be placed |
| Cycle stock allowance | Minimum order quantity or container fill constraints |
Targets should also differ by item class. An ABC segmentation typically justifies tight cover on high-value A items where carrying cost bites hardest, and looser cover on low-value C items where the cost of a stockout exceeds the cost of holding a few extra weeks. A single portfolio-wide target guarantees misallocation in both directions.
Running the days of supply calculator against each class separately makes that difference visible, and usually shows that the items generating most of the working capital are not the items generating most of the stockouts.
What each day of cover actually costs
Every day of stock carries a cost, and expressing the target that way changes how the conversation goes.
At a twenty-four percent annual carrying rate, inventory worth 75,600 costs roughly 50 a day simply to hold. Removing ten days of cover on that item releases around 500 a year permanently, plus the one-off working capital release from the stock itself.
That framing converts an inventory policy debate into a financial one, which is usually where it belonged. The wider cost mechanics are covered in reducing transportation cost in logistics.
Using it as a weekly exception report
The most valuable application is not reviewing items individually but sorting the entire portfolio by cover and working the two extremes.
Items below lead time need immediate action: expedite, substitute or allocate. Items above roughly double target are candidates for review, because they represent either a demand collapse nobody flagged or a target that no longer reflects reality.
Run weekly, that sorted list is a complete replenishment and obsolescence agenda produced without anyone deciding what to look at. It also surfaces slow-moving and dead stock months earlier than a quarterly review would, which is while something can still be done about it.
Supply reliability sits underneath all of this, since a supplier whose delivery performance is deteriorating erodes every cover position at once. That relationship is examined in managing supply chain risk.
Bear in mind that the days of supply calculation assumes demand continues at the rate entered, so it is a snapshot rather than a forecast. Recalculate against forward demand whenever the plan changes materially. The days of supply calculator above is built for exactly that, which is why it accepts daily, weekly, monthly or annual demand rather than forcing a single basis. For continuing coverage of inventory, planning and service performance, see our ongoing supply chain operations reporting.
Frequently asked questions
How to calculate days supply of inventory
Divide units on hand by average daily usage. If you hold 4,200 units and consume 140 a day, that is 30 days of supply. Use the same unit of measure on both sides of the division, since mixing cases and eaches is the most common source of error.
How to calculate days of supply on hand
Use only the physical on-hand balance, excluding stock already allocated to open orders and excluding anything still inbound. On-hand cover answers what you could ship today, which is a different and usually smaller number than projected cover including purchase orders.
How is days of inventory supply calculated
At portfolio level it is calculated from financial data as average inventory divided by cost of goods sold, multiplied by 365. That produces days inventory outstanding, suitable for benchmarking but too aggregated to drive replenishment decisions for individual items.
How to calculate days of supply in inventory
For a multi-item view, calculate cover per item and report the distribution rather than the average. A portfolio averaging 45 days can still contain items at 5 days and items at 400, and the average conceals both the stockout risk and the obsolescence exposure.
How to calculate days of supply
Stock on hand divided by average daily demand, using forward demand from the plan rather than trailing history for anything with trend or seasonality. Compare the result to supplier lead time, because cover only means something relative to how long replenishment takes.